This tutorial provides a tutorial on using the code and data for our paper “A resolution adaptive deep hierarchical (RADHicaL) learning scheme applied to nuclear segmentation of digital pathology images” by Andrew Janowczyk, Scott Doyle, Hannah Gilmore, and Anant Madabhushi.
Abstract
Deep learning (DL) has recently been successfully applied to a number of image analysis problems. However, DL approaches tend to be inefficient for segmentation on large image data, such as high resolution digital pathology slide images. For example, a typical breast biopsy images scanned at 40x magnification contain billions of pixels, of which usually only a small percentage belong to the class of interest. For a typical naive deep learning scheme, parsing through and interrogating all the image pixels would represent hundreds if not thousands of hours of compute time using high performance computing environments. In this paper we present a resolution adaptive deep hierarchical (RADHicaL) learning scheme wherein DL networks at lower resolutions are leveraged to determine if higher levels of magnification, and thus computation, are necessary to provide precise results. We evaluate our approach on a nuclear segmentation task with a cohort of 141 ER+ breast cancer images and show we can reduce computation time on average by about 85%. Expert annotations of 12,000 nuclei across these 141 images were employed for quantitative evaluation of RADHicaL. A head-to-head comparison with a naive DL approach, operating solely at the highest magnification, yielded the following performance metrics: .9407 vs .9854 Detection Rate, .8218 vs .8489 F-score, .8061 vs .8364 True Positive Rate (TPR) and .8822 vs .8932 Positive Predictive Value (PPV). Our performance indices compare favorably with state of the art nuclear segmentation approaches for digital pathology images.
Overview
Our procedure consists of 7 steps:
- Create patches at the various abstraction layers
- Create training and testing lists
- Create databases
- Train Classifiers
- Generate outputs of validation set
- Determine optimal threshold using validation set
- Generate outputs of test set
1. Create patches at the various abstraction layers
Firstly, we must extract the necessary patches from each of the images. We use matlab to do this. We launch a matlab pool to write multiple patches to disk at the same time, but this process then becomes IO bound as hard drives are incapable of keeping up with the write speed necessary to have high throughput patch creation. As a result, we save all of the patches to a large ram disk, which provides orders of magnitude speed improvements.
An example of creating a 30GB ram disk in linux (assuming more than 30GB of memory is available) is:
sudo mount -t tmpfs -o nr_inodes=0,size=30g tmpfs /mnt/rammdisk/
Since there will be a very large number of patches, we need to set an infinite amount of inodes, otherwise we’ll be unable to write all the patches to disk. At all times, we must ensure that every operation can be completed within the available memory. If not, there are 2 consequences, (a) swap disk space becomes used as a memory replacement, drastically slowing down the overall system (using disk space to replicate ram because your using ram to replicate a hard drive…), and (b) in extreme cases, the system will completely halt.
With that said, we copy the tif files and their associated binary masks, which contain an incomplete annotation of nuclei per image, to the ram disk, launch matlab and open a matlab pool to ensure full usage of all cpu resources. This is trivially done using:
> matlabpool open
Afterwards, we launch step1_levels_make_patches_3class.m to make the patches. Here we will discuss a few aspects of the code.
1.1 Selection of magnifications
- %select the appropriate magnifications.
- %They should be in size order where 1 is the original magnification and any fraction
- %is a percentage reduction which is fed directory into imresize
- levels_redux=[1, 0.5, 0.25, 0.1];
Here, our base images are at 40x, and we compute additional abstractions at 20x, 10x and 4x. These levels were chosen as they typically correspond with the image layers saved in svs and big tiff images. This implies that we can have access to “original” versions of these images, which are not interpolated between resolutions. Depending on the size of the target objects, this can of course be adjusted accordingly.
1.2 Determine ratio of patches
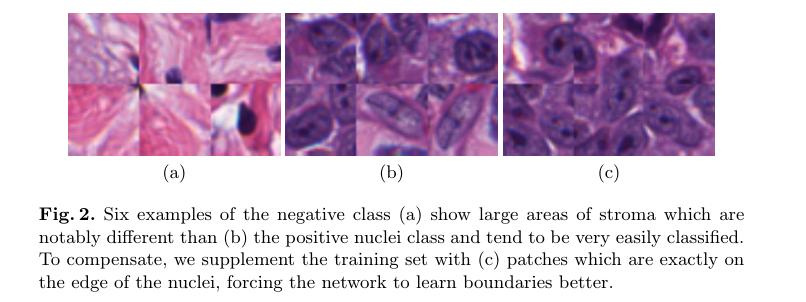

Since we’re only very confident of our positive nuclei class, we use that as the basis for selecting the other classes. For the nuclei dilation mask class ( which acts as part of our negative class specifically training to increase the fidelity of the delineation of the nuclei boundaries, see Figure 3c above), and for the background class (which is also put in the negative class but contains ‘easier’ examples, see Figure 2a above), we use ratios as compared to the positive class to ensure a closely balanced training set. This approach also affords us the opportunity to accurately approximate the total number of patches which our system will generate.
Since we have 141 images we can expect: 141 * (500 positive + 500 edge + 150 background) = ~162k patches. We also have the option of adding in rotations, which must be done at patch creation time since Caffe does not yet support random rotation in its training scheme (though random mirroring is supported). Assuming 2 rotations (0 and 90 degrees as used in this paper), we explicitly create 324k patches, which is implicitly (through mirroring) trained as 648k. More than a sufficient amount to prevent over fitting in our relatively small 32 x 32 Alexnet network.
1.3 Break down images by patient
Only a short comment here. It is absolutely imperative when analyzing images to break images down into groups by patient. Frequently a single patient will have multiple images associated with their case, as pathologists identify different regions of interest from larger biopsy specimens. All of a single patient’s images should either go into the training set or the test set. That is to say, there should never be a case where some images from a single patient are in the training set and some are in the testing set, since both of them fundamentally represent the same signal, this is perceived as training on the testing set. A big no no.
In our case, since we know that the first part of our filename (e.g, 10262 in 10262_500_f00357_original.tif ) represents a unique patient ID, so we cluster the images by this leading id number:
- % exploit filename format to break images down by patient
- patients=unique(arrayfun(@(x) x{1}{1},arrayfun(@(x)...
- strsplit(x.name,'_'),files,'UniformOutput',0),'UniformOutput',0));
1.4 Final statistics
Our final patches, for the 4 levels, take about 5GB, and has about as many patches as our estimate predicted.
| Level | Num Patches | Data Size |
| subs_1 | 324301 | 1.3GB |
| subs_2 | 423001 | 1.7GB |
| subs_3 | 422247 | 1.7GB |
| subs_4 | 289123 | 1.2GB |
We note that the lowest magnification has less patches. This is not unsurprising as the images are notably smaller and it may not be possible to pull the requested number of patches from it.
1.5 File type note
Typically we use png files as the export type from matlab to be able to save a bit of disk space. If you’re planning on running a comparison with wndchrm, make sure to save tif files as their application does not support any other filetype and converting all the png patches to tif patches is very time consuming.
2 Create training and testing lists
We encourage the reader to look at the associated source code of step2_levels_make_training_lists.m as its rather straight forward but we have a brief discussion here.
Once the patches are generated, we need to split, at the patient level, the patches into training and testing lists so that in the next step we can make databases from them. Eventually our goal is to feed these patches, via lists, to caffe so that we can build an appropriate leveldb for high throughput access.
Firstly, we save 2 files, one for training and 1 for testing, which contains the base patient id numbers, so that we can know quickly which patients were used for training and testing.
Next, for each level, we save 2 files, again 1 for training and 1 for testing, but this time at the patch level. The second file, which will be fed into the database script, is simply a tab delimited text file which contains the filename of the patch created in the previous step, a tab, and then the associated class where “0” represents the negative class and “1” represents the positive class.
The final result looks something like this:
./test_w32_parent_1.txt
./train_w32_parent_1.txt
./subs_1/test_w32_1.txt
./subs_1/train_w32_1.txt
./subs_2/test_w32_1.txt
./subs_2/train_w32_1.txt
./subs_3/test_w32_1.txt
./subs_3/train_w32_1.txt
./subs_4/test_w32_1.txt
./subs_4/train_w32_1.txt
Where the _1 indicates that this is for the first of K folds usable in cross validation.
3 Create Databases
The reason why we use databases, instead of image files, is because the databases are designed for very high throughput read ahead usage. This means that during training time caffe can pre-load images easily and quickly while its operating on the previous batch, further decreasing the time required for training. We need to consider that in many cases, operating systems become very slow when there are a large number of files in a directory, for example, a simple “ls” command in a directory with over 1M files (of any size), will cause a very notable pause.
Anyway, we’ve written a bash script which loops through all of the levels, and all of the folds, to create the databases, called make_dbs_level_multi.sh
The concept is very simple, with nested loops, we go into each sub directory, read the associated training and testing patch level files (train_w32_1.txt and test_w32_1.txt respectively for fold 1). And run the following commands:
~/caffe/build/tools/convert_imageset -shuffle -backend leveldb ./ train_w32_${kfoldi}.txt ../DB_train_${kfoldi}_${li} &
~/caffe/build/tools/convert_imageset -shuffle -backend leveldb ./ test_w32_${kfoldi}.txt ../DB_test_${kfoldi}_${li} &
Where li is the level index (in our case, ranging from 1 to 4) and kfoldi is the fold index. We note that it is absolutely necessary to shuffle the training (but not testing database) otherwise training will not be successful. Also, a test database is not necessary, but used here to provide patch level statistics reported in the paper. If ground truths are not available, it is not strictly necessary to use a testing set. Since we use Adagrad at a fixed number of iterations, we have not set up a validation set since we’re assured that the system cannot over fit because of the large number of patches.
After we have the databases, we compute the mean image which will be used to zero-mean transform the training and testing data. This is also a provided utility from within caffe:
~/caffe/build/tools/compute_image_mean DB_train_${kfoldi}_${li} DB_train_w32_${kfoldi}_${li}.binaryproto -backend leveldb
We chose leveldb since our tests have shown a greater compression ratio.
This leaves us with the following files:
DB_test_1_1
DB_test_1_2
DB_test_1_3
DB_test_1_4
DB_train_1_1
DB_train_1_2
DB_train_1_3
DB_train_1_4
DB_train_w32_1_1.binaryproto
DB_train_w32_1_2.binaryproto
DB_train_w32_1_3.binaryproto
DB_train_w32_1_4.binaryproto
Which we now copy off of the ram disk back on the hard drive. Its also nice to keep a copy of the parent test/train files so that we know which files have been held back for testing.
4 Train Classifiers (using Case Western HPC)
Once the databases are built, we need to launch M training instances. Since each training instance is independent, we can train them in parallel to cut down on overall training time. To aid in this process, we have set up a series of scripts which use “BASE” files, from which specific versions (fold and level) are instantiated. There are 3 BASE files:
BASE-alexnet_solver_ada.prototxt: This describes our solver protocol, specifying that we’ll be using AdaGrad and the maximum number of iterations. The unique variable here that needs to be filled in is test_iter, which is the # of test samples in the test database divided by the batch size. This ensures that when we test, we test on the whole test set to report accurate statistics
BASE-alexnet_traing_32w_db.prototxt: This file contains the network’s architecture, which is held constant for every level, but in particular we need to change where the location of the associated training and testing databases are located. Circa lines 8 and 24. Also we need to specify the location of the mean file that we created above.
BASE-qsub.pbs: this is the job script which will be sent to torque, specifying that we need a gpu, and our expected (upper bound) execution time. There seems to be some issue with the HPC where on occasion, if there are multiple GPUs on the machine and 1 is busy, the available one isn’t assigned, to prevent that from happening we modify the CUDA_VISIBLE_DEVICE to ensure the correct GPU is used:
output=`nvidia-smi -q -d “PIDS” –id=0`
if ! [[ $output == *”None”* ]];
then
export CUDA_VISIBLE_DEVICES=1
fi
With these base files, we create and submit jobs using submit_jobs_levels.py, this very simply takes the base files, inserts the k-fold and the level indexes and launches the jobs.
5 Generate outputs of validation set
Once we have all of the models generated, of which there are 4, one for each of our desired levels, we need to determine optimal thresholds for each level. To do this, we create a valid set using the first 10 parents from the test file. From the directory which contains all of our image files:
mkdir valid
cat ../test_w32_parent_1.txt |head -n 10 | xargs -n 1 -I@ sh -c “cp -t ./valid @* “
Now that we have all of the validation files in a separate directory, we generate full output for each them, which means, compute 100% of the pixels at each of the levels so that later we can find the optimal threshold as determined by the manually annotated mask.
For this we use our python script create_output_image_vector.py 4 times, once per level:
python create_output_image_vector.py -b “*.tif” 4 10
python create_output_image_vector.py -b “*.tif” 3 4
python create_output_image_vector.py -b “*.tif” 2 2
python create_output_image_vector.py -b “*.tif” 1 1
The command line arguments are explained via the argparse:

6 Determine optimal threshold using validation set
Once we have the validation set generated, we need to determine what the associated thresholds for the various levels are. We use find_per_level_2thresh.m to help perform this procedure.
The approach is iterative, where at each iteration we make a decision of what threshold is most attractive to us based on either computational properties or f-score properties. Initially, we find a suitable threshold for the first level using something like this on line 44:
- io_mask=get_masks_2thresh_3class(strrep(fname,'_1_prob.png',''),'%s_%d_prob.png',...
- [ts(ti) 0 0 0],[-1 1 1 1]);
then, after we see find the best f-score’s associated threshold, we input it in there and find the upper bound threshold:
- io_mask=get_masks_2thresh_3class(strrep(fname,'_1_prob.png',''),'%s_%d_prob.png',...
- [.5267 0 0 0 ],[-1 ts(ti) 1 1 1]);
Afterwards we find the next level’s threshold and then upper threshold:
- io_mask=get_masks_2thresh_3class(strrep(fname,'_1_prob.png',''),'%s_%d_prob.png',...
- [.5267 ts(ti) 0 0],[-1 .61 1 1]);
- io_mask=get_masks_2thresh_3class(strrep(fname,'_1_prob.png',''),'%s_%d_prob.png',...
- [.5267 .733 0 0],[-1 .61 ts(ti) 1]);
This continues for each level. Using this procedure, we find our optimal configuration, we mentioned in the manuscript:
- io_mask=get_masks_2thresh_3class(strrep(fname,'_1_prob.png',''),'%s_%d_prob.png',...
- [.5267 .733 .18 .12 ],[-1 .61 0.8267 .16]);
7 Generate outputs of test set
7.1 Naïve approach
The naïve approach, where every pixel is computed is straight forward. We can use the nuclei_direct.pbs to submit jobs to the HPC, but besides the window dressing needed to inform torque of the resources necessary, the core component is:
python create_output_image_vector.py -b “*.tif” 1 1
This runs the python script create_output_image_vector.py, and we briefly explain what the command line arguments do:
“–b” indicates that this is a bottom level approach, i.e., there is no lower level available to mask out pixels which don’t need to be computed. As a result, internally, the script creates an image of the same dimensions as the input image where every pixel is set to true (i.e., requires computation).
“*.tif” tells the script to operate on all tif images in the directory.
The first 1 indicates that it should use the first level classifier (which was trained at 40x in our case)
The second 1 indicates that there should be no rescaling factor (i.e., resize the image to 100% the image size…so..do nothing).
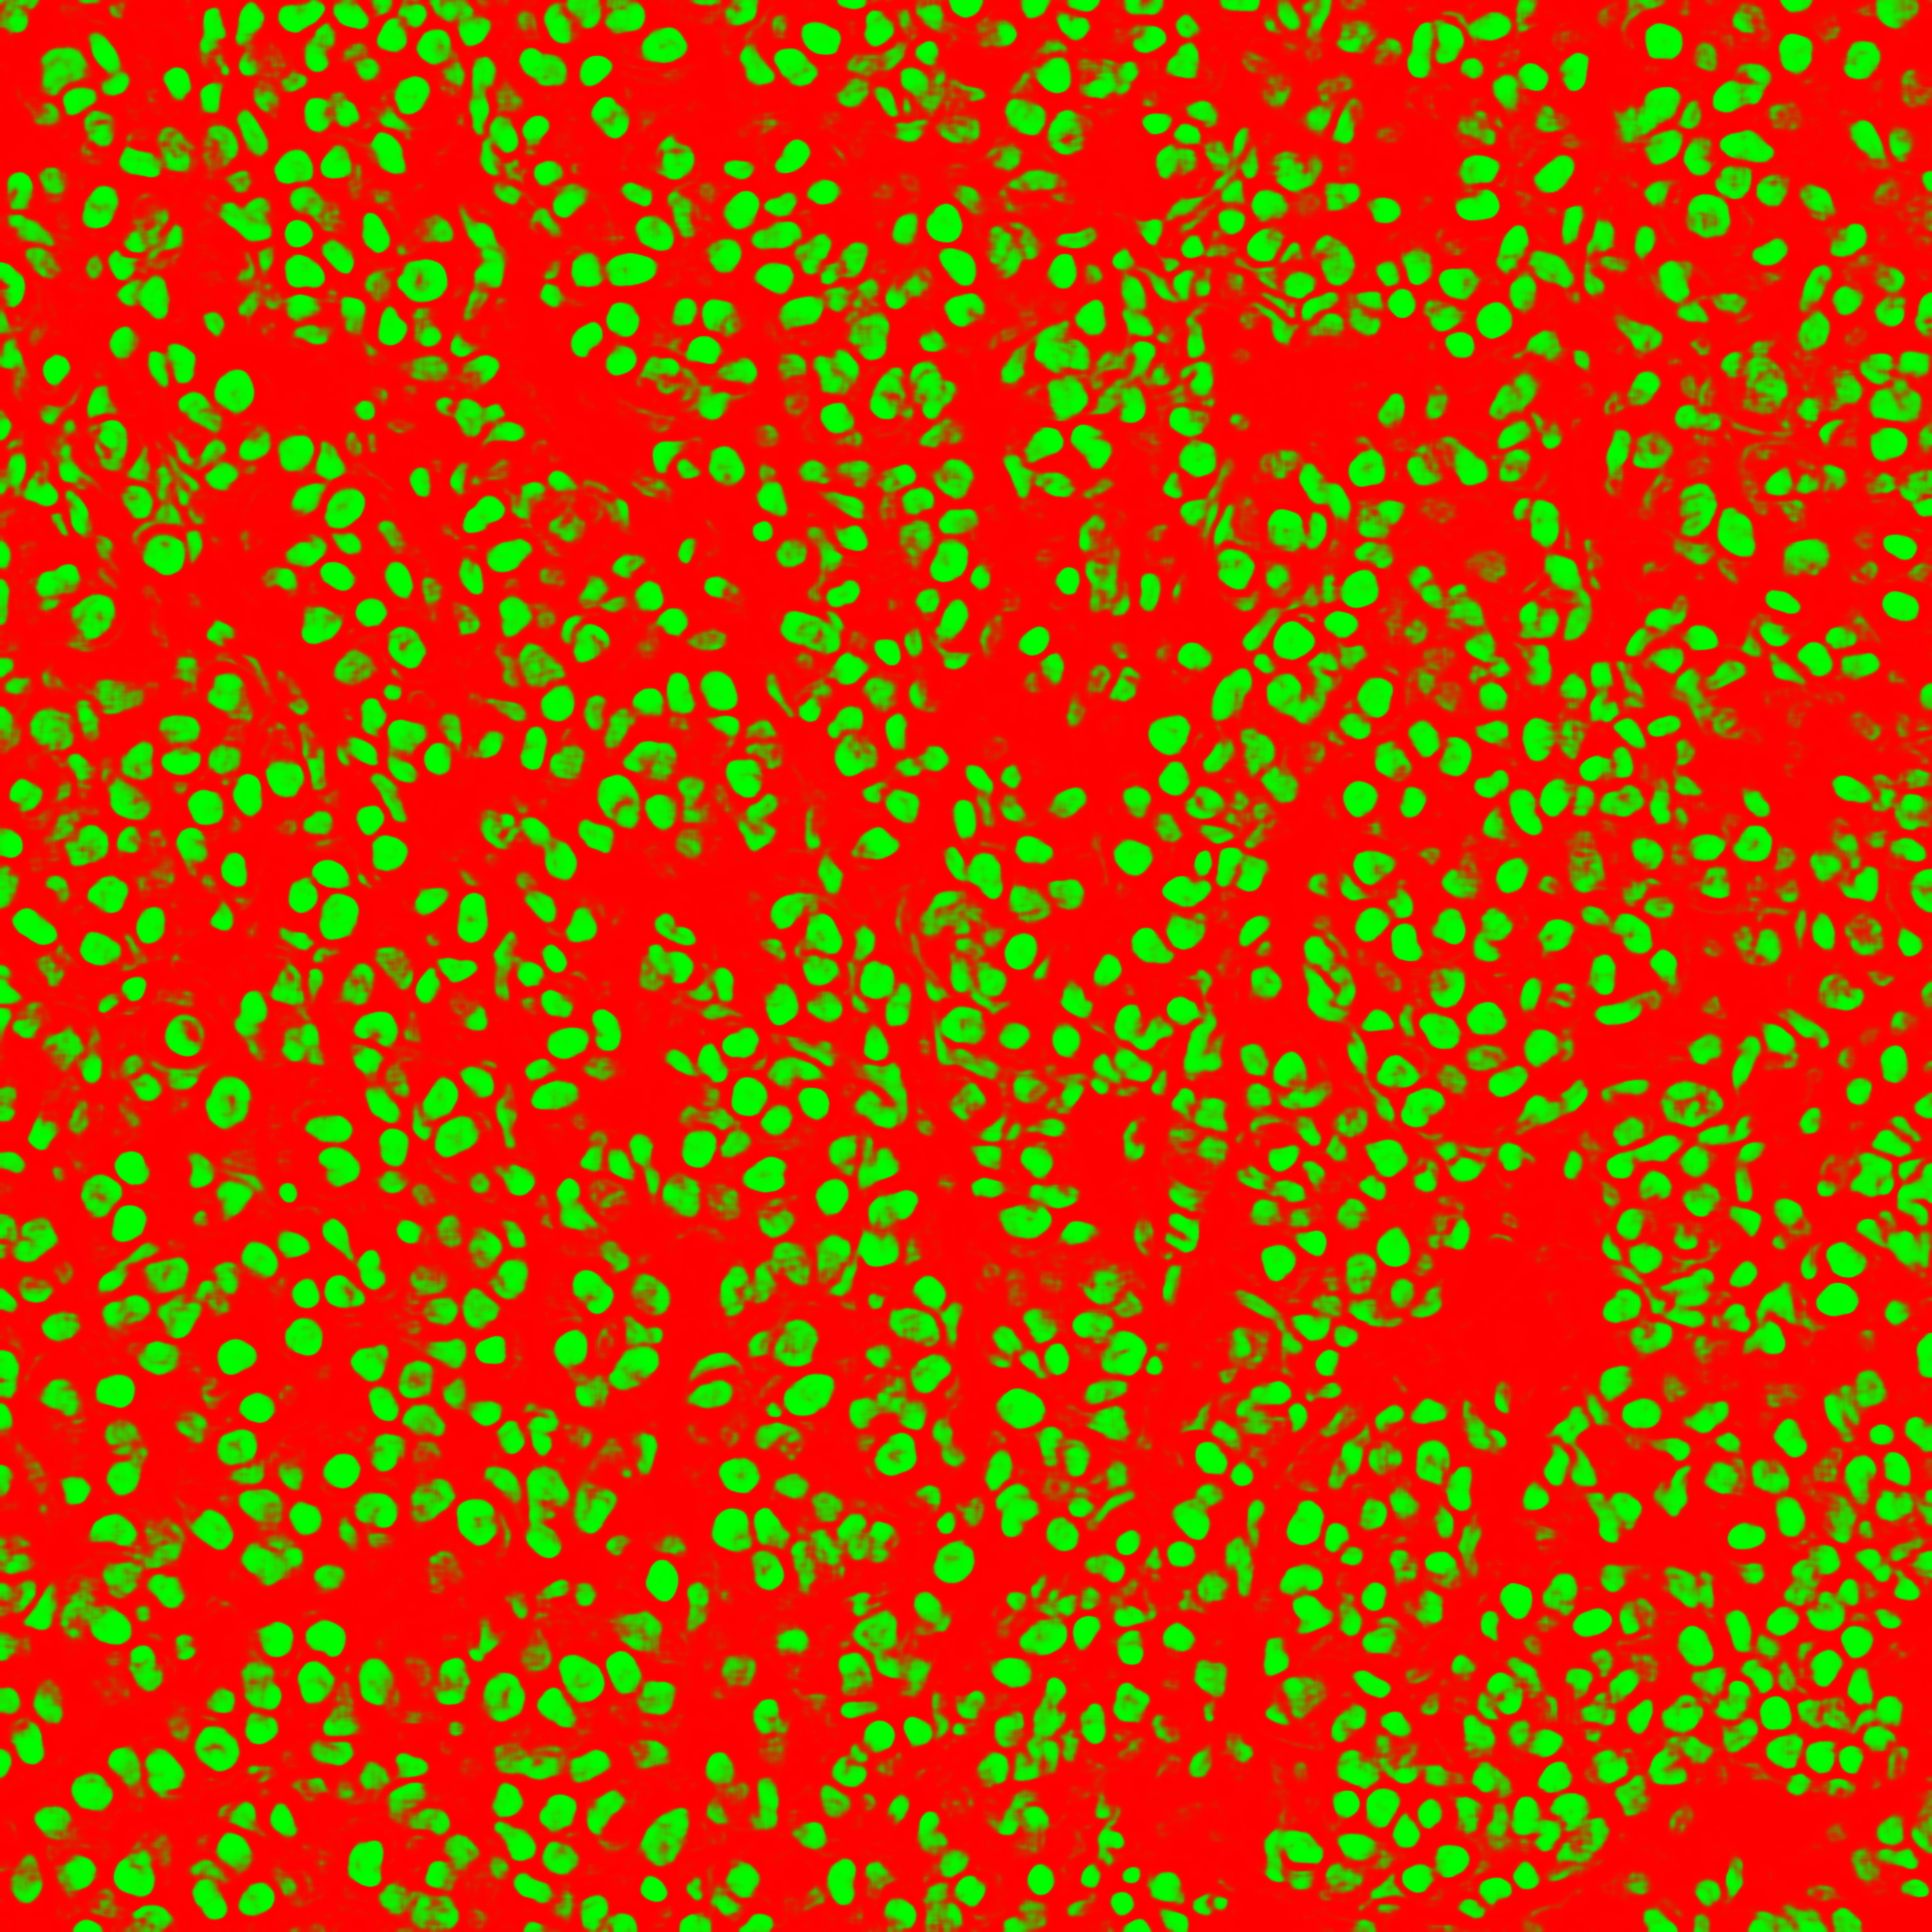
Since we’ve set every pixel to true, every pixel is computed. Afterwards we’re left with an output image. The “probs” file mask creates a 3 channel image, where the first channel is [0,1] representing the likelihood that the pixel belongs to the 0 class, the 2nd channel is also [0,1] and is the probability that the pixel belongs to the 1 class. Only one is necessary as prob_0 + prob_1 = 1. The last channel is set to zeros. Since its 3 channel output, though, it is very easy to view using python/matlab/image viewers 🙂
7.2 RADHicaL approach
To generate our approach, we use the same python file (create_output_image_vector.py) except with the following command line arguments:
- python create_output_image_vector.py "*.tif" 4 10 -b
- python create_output_image_vector.py "*.tif" 3 4 --thresh_lower .12 --thresh_upper .16
- python create_output_image_vector.py "*.tif" 2 2 --thresh_lower .18 --thresh_upper .8267
- python create_output_image_vector.py "*.tif" 1 1 --thresh_lower .733 --thresh_upper .61
We can see as before, the first command will produce the output on every pixel of the input image, except in this case, we’re operating on the 4th level which coincides with a 1/10th reduction in magnification.
Afterwards, we use the same script again, except specify that we’ll be using the 3rd level classifier, which coincides with a magnification reduction of 1/4. Also, we set the upper and lower threshold. All pixels from the previous level which are above the thresh_upper are automatically added to the output image, while any pixels between the thresh_lower and thresh_upper are computed. Any pixel below that threshold is assumed to be in the negative class and thus not computed. The thresholds here are the ones we found in the previous section using the validation set.
As a result, we can see the output from the various levels, produced 75% faster than performing a naive pixel wise application of the DL classifier:
For this original image:
That’s it! Please feel free to drop me a line if you have any questions.
And, of course, all source code is available here.
thank you
you’re welcome
GREAT JOB !!!
Thank you.
Meticulously done ,thank u…